IC Markets Home Sign in Web Trader Contáctanos
IC Markets Social IC Markets Social

Información para
Operadores Serios

  • Acerca de IC Markets
  • ABRA UNA CUENTA BURSÁTIL
  • PRUEBE UNA DEMO GRATIS
  • Comienza a Operar
  • VISIT OUR BLOG
IC Markets Social
  • Acerca de IC Markets
  • ABRA UNA CUENTA BURSÁTIL
  • PRUEBE UNA DEMO GRATIS
  • Comienza a Operar
  • VISIT OUR BLOG
June 23, 2024Australian_Stocks_enIC Markets

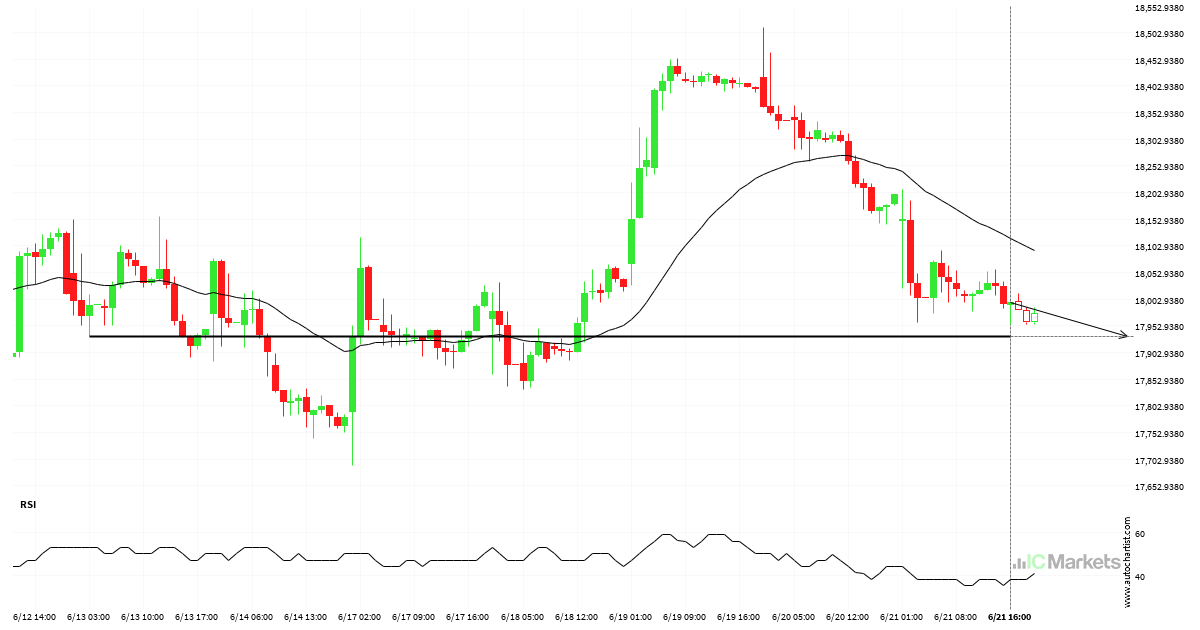
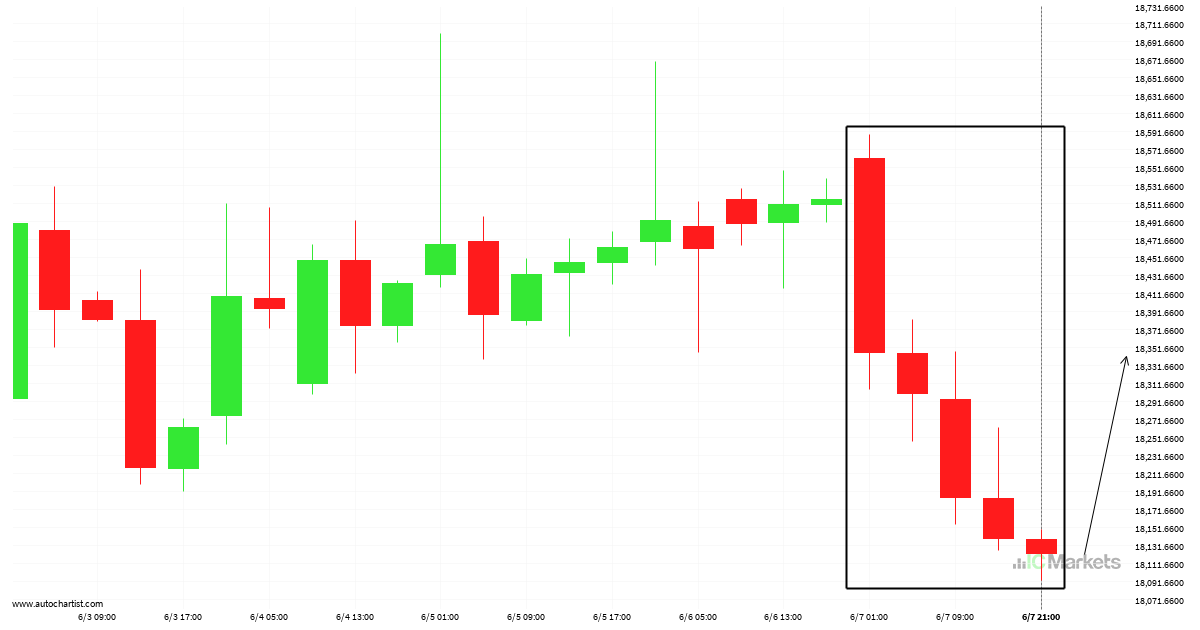
Hong Kong 50 Index short term bearish trade setup to 17933.6699

Hong Kong 50 Index is heading towards 17933.6699 and could reach this point within the next 2 days. It has tested this line numerous times in the past, and this time could be no different, ending in a rebound instead of a breakout. If the breakout doesn’t happen, we could see a retracement back down […]

Read more
June 21, 2024Australian_Stocks_enIC Markets

Is FTSE China A50 Index likely to correct after this massive movement?

FTSE China A50 Index has experienced an exceptionally large movement lower by 1.52% from 12215.32 to 12030.07 in the last 2 days.

Read more
June 19, 2024Australian_Stocks_enIC Markets

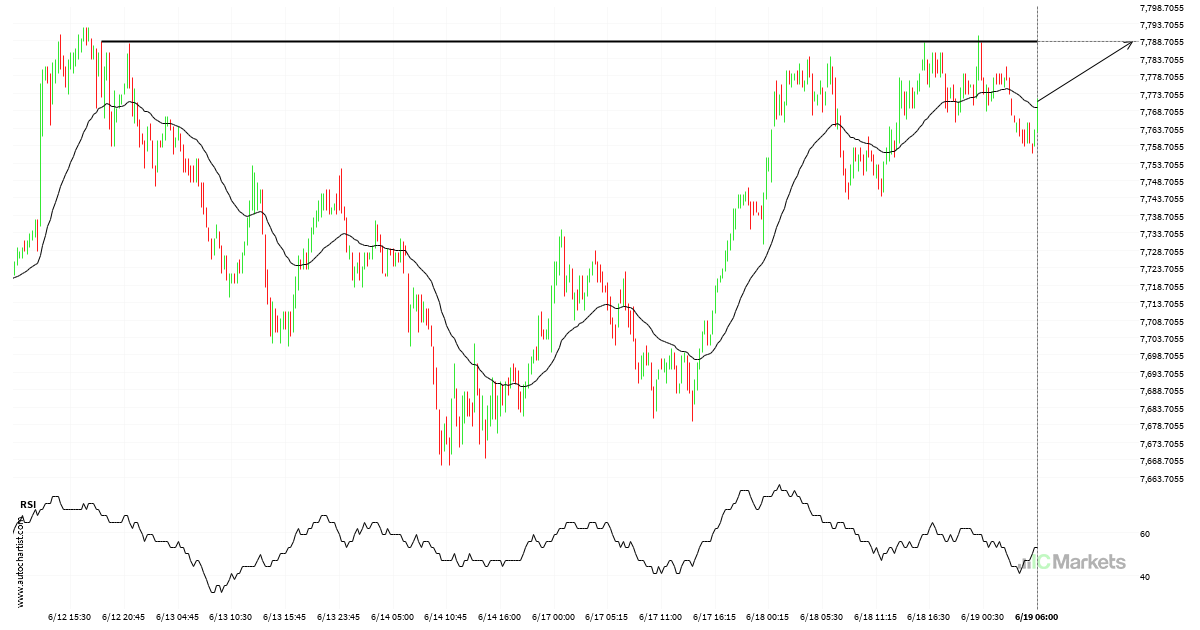
Australia 200 Index short term bullish trade setup to 7788.4399

The movement of Australia 200 Index towards 7788.4399 price line is yet another test of the line it reached numerous times in the past. We could expect this test to happen in the next 23 hours, but it is uncertain whether it will result in a breakout through this line, or simply rebound back to […]

Read more
June 18, 2024Australian_Stocks_enIC Markets

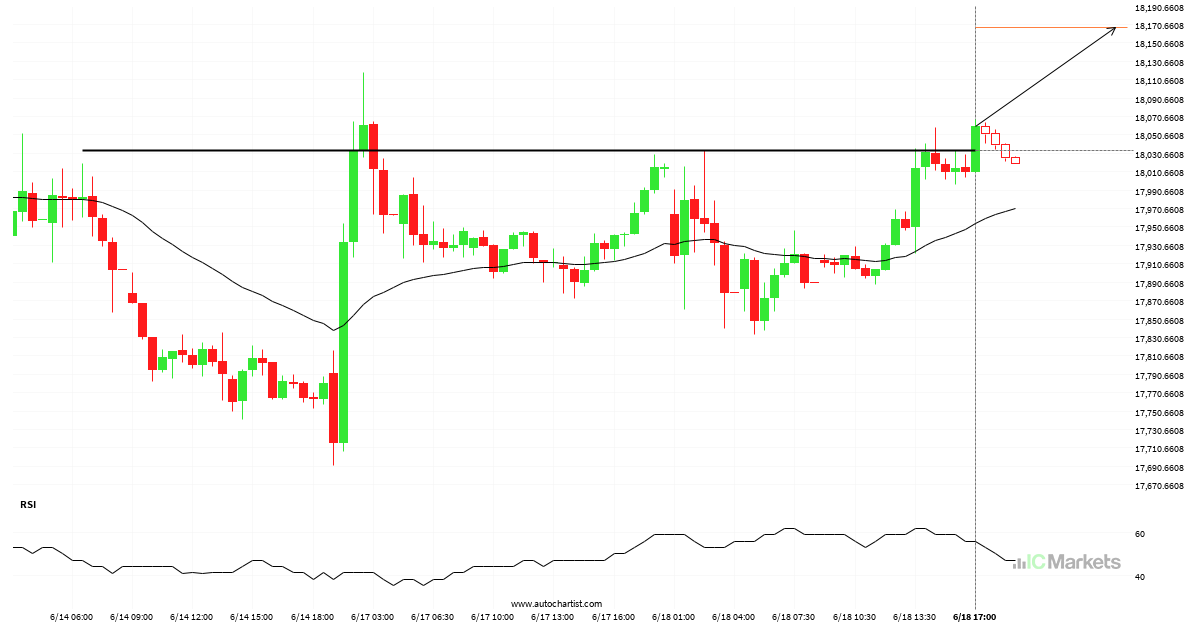
Should we expect a bullish trend on Hong Kong 50 Index?

The breakout of Hong Kong 50 Index through the 18034.0391 price line is a breach of an important psychological price that is has tested numerous in the past. If this breakout persists, Hong Kong 50 Index could test 18166.9141 within the next 9 hours. One should always be cautious before placing a trade, wait for […]

Read more
June 17, 2024Australian_Stocks_enIC Markets

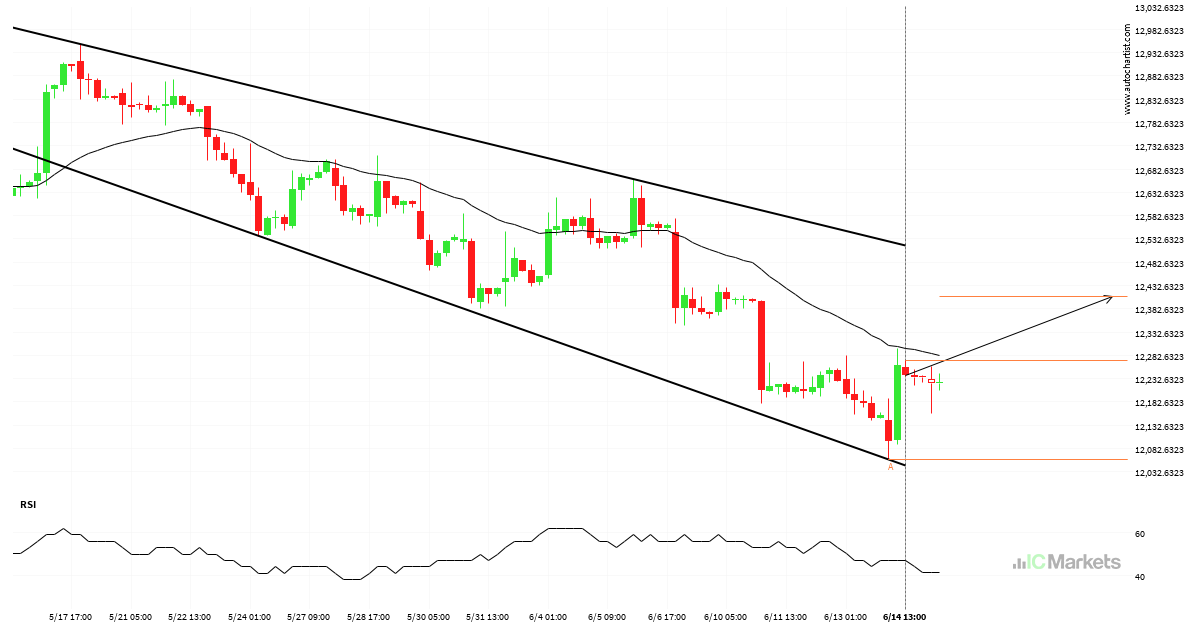
FTSE China A50 Index – Continuation Chart Pattern – Channel Down

FTSE China A50 Index is trapped in a Channel Down formation, implying that a breakout is Imminent. This is a great trade-setup for both trend and swing traders. It is now approaching a support line that has been tested in the past. Divergence opportunists may be very optimistic about a possible breakout and this may […]

Read more
June 13, 2024Australian_Stocks_enIC Markets

Will Hong Kong 50 Index have enough momentum to break support?

An emerging Falling Wedge has been detected on Hong Kong 50 Index on the 4 hour chart. There is a possible move towards 17694.4094 next few candles. Once reaching resistance it may continue its bearish run or reverse back to current price levels.

Read more
June 13, 2024Australian_Stocks_enIC Markets

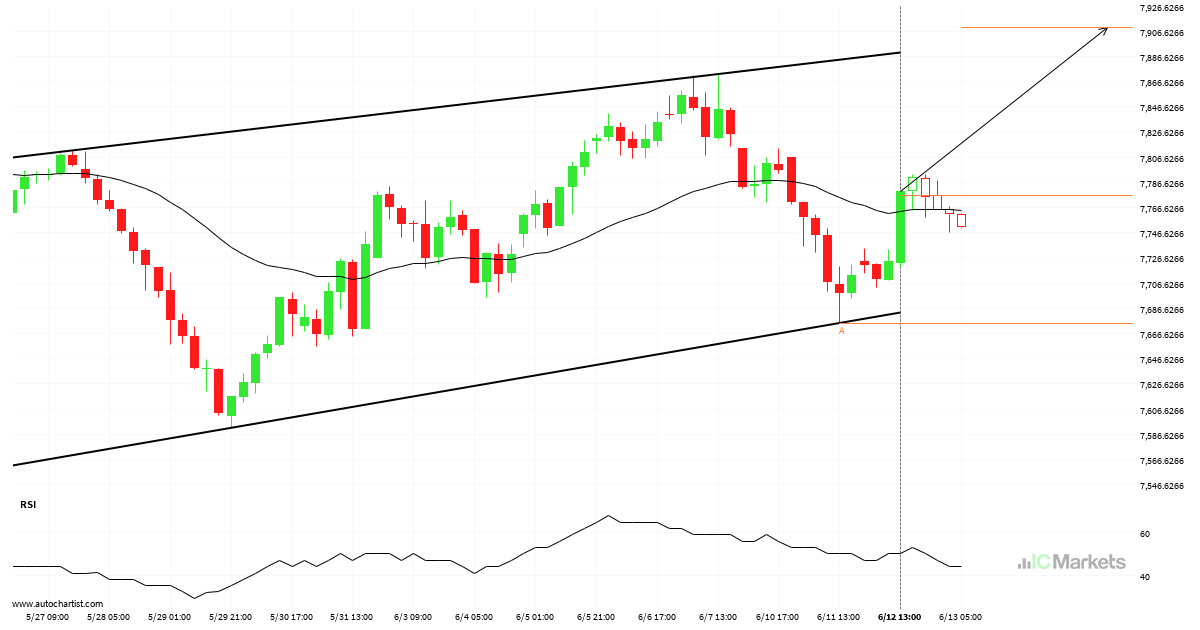
Australia 200 Index – getting close to resistance of a Channel Up

Australia 200 Index was identified at around 7776.44 having recently rebounded of the support on the 4 hour data interval. Ultimately, the price action of the stock has formed a Channel Up pattern. This squeeze may increases the chances of a strong breakout. The projected movement will potentially take the price to around the 7909.2667 […]

Read more
June 12, 2024Australian_Stocks_enIC Markets

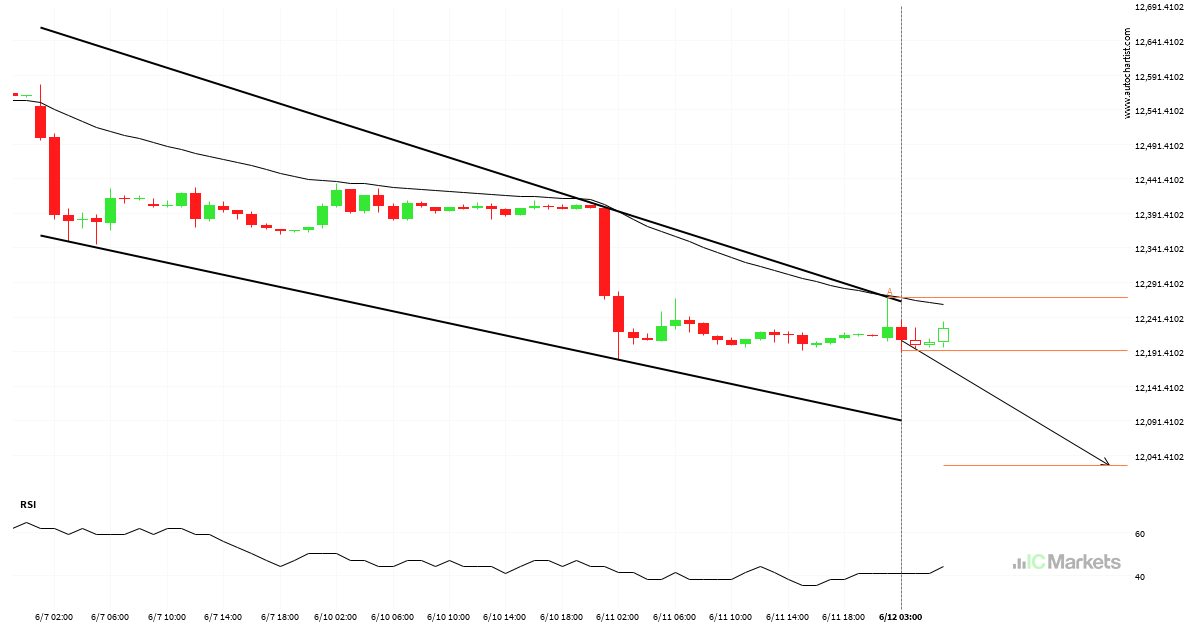
Should we expect a breakout or a rebound on FTSE China A50 Index?

FTSE China A50 Index was identified at around 12192.73 having recently rebounded of the resistance on the 1 hour data interval. Ultimately, the price action of the stock has formed a Falling Wedge pattern. This squeeze may increases the chances of a strong breakout. The projected movement will potentially take the price to around the […]

Read more
June 11, 2024Australian_Stocks_enIC Markets

Rare opportunity on FTSE China A50 Index – extreme bearish movement

FTSE China A50 Index hits 12210.88 after a 1.54% move spanning 12 hours.

Read more
June 9, 2024Australian_Stocks_enIC Markets

Where is Hong Kong 50 Index moving to?

Trend followers are probably eagerly watching Hong Kong 50 Index to see if its latest 5 consecutive candles continues. If not, the mean-reversion people out there will be delighted with this exceptionally large 20 hours move.

Read more
  • 1
  • 2
  • 3
  • …
  • 8
  • 9
  • 10
  • 11
  • 12
  • 13
  • 14
  • …
  • 153
  • 154
  • 155

Recent Posts

  • Either a rebound or a breakout imminent on SILVER
  • GOLD Nível visado: 2976.3601
  • A potential bearish movement on GOLD
  • มีโอกาสเกิดการเคลื่อนตัวแบบ bearish บน GOLD
  • Posible gran movimiento en el AUDJPY

Recent Comments

    Traducción


     Edit Translation

    Opere con un

    líder del mercado en el que puede confiar

    ABRA UNA CUENTA BURSÁTIL PRUEBE UNA DEMO GRATIS

    Trading en Forex

    • Qué es Raw Spread
    • Resumen de cuentas
    • Abre una Cuenta
    • Trader Launch en Web

    Especificaciones de Trading

    • Spreads y Comisiones
    • Rango de Mercados
    • Horas de Trading
    • Depósitos
    • Retiros

    Acerca de IC Markets

    • Help Center
    • Por qué con IC Markets
    • Regulación
    • Documentos Legales
    • Contáctanos


    Forex Trading

    • Accounts Overview
    • Open an Account
    • Launch Web Trader

    Trading Specifications

    • Spreads and Commissions
    • Range of Market
    • Trading Hours
    • Funding
    • Withdrawal

    About IC Markets

    • Chat with a Specialist 24/7
    • Why IC Markets
    • Regulation
    • Legal Documents
    • Contáctanos

    Descargo de responsabilidad: Estos documentos son material de marketing cuyo contenido es publicado solo con propósitos informativos. Este material no contiene y no debe ser considerado un consejo de inversión y recomendaciones, o sugerencias para llevar a cabo otras acciones con los instrumentos financieros. Los widgets integrados pertenecen a sus autores independientes externo, y IC Markets no es responsable de su contenido o cómo afectan en las operaciones.

    Derechos reservados de todo el contenido. Las opiniones de los autores tal vez no coincidan con la opinión de los editores del blog. Cuando copie material de este sitio o conecte RSS para volver a publicar nuestros artículos, es obligatorio el enlace a IC Markets o la atribución en el formato “Blog de IC Market”. Para dudas generales, por favor, póngase en contacto con la oficina editorial a través de la página “Contacto”.

    Advertencia de riesgo: Operar derivados conlleva un altor riesgo en su capital y solo debería operar con capital que puede permitirse perder. Las operaciones con derivados podrían no ser adecuadas para todos los inversores, por lo tanto, asegúrese de entender por completo los riesgos que conlleva y buscar asesoramiento independiente si fuera necesario. Una Declaración de Divulgación del Producto (PDS, por sus siglas en inglés) se tendrá en cuenta antes de participar en una transacción con nosotros.

    Los contenidos de esta página son solo información general y no tienen en cuenta su situación personal, objetivos financieros o necesidades. Depende de usted garantizar que los productos que ofrecemos se ajustas a sus necesidades específicas. No debería operar con nosotros a menos que entienda las características y riesgos de los productos que ofrecemos. Esto significa que tal vez necesite buscar asesoramiento independiente antes de empezar a operar con nosotros.

    © 2022 Raw Trading Ltd | All rights reserved.
    • Sample Page